Nature-Based Parenting Guide
Welcome to the comprehensive guide for raising children connected to nature. This journey combines ancient wisdom with modern understanding to create meaningful childhood experiences.
Studies show that children who spend regular time in nature have improved attention spans, reduced stress levels, and enhanced creativity. Learn more at our Nature Education Hub.
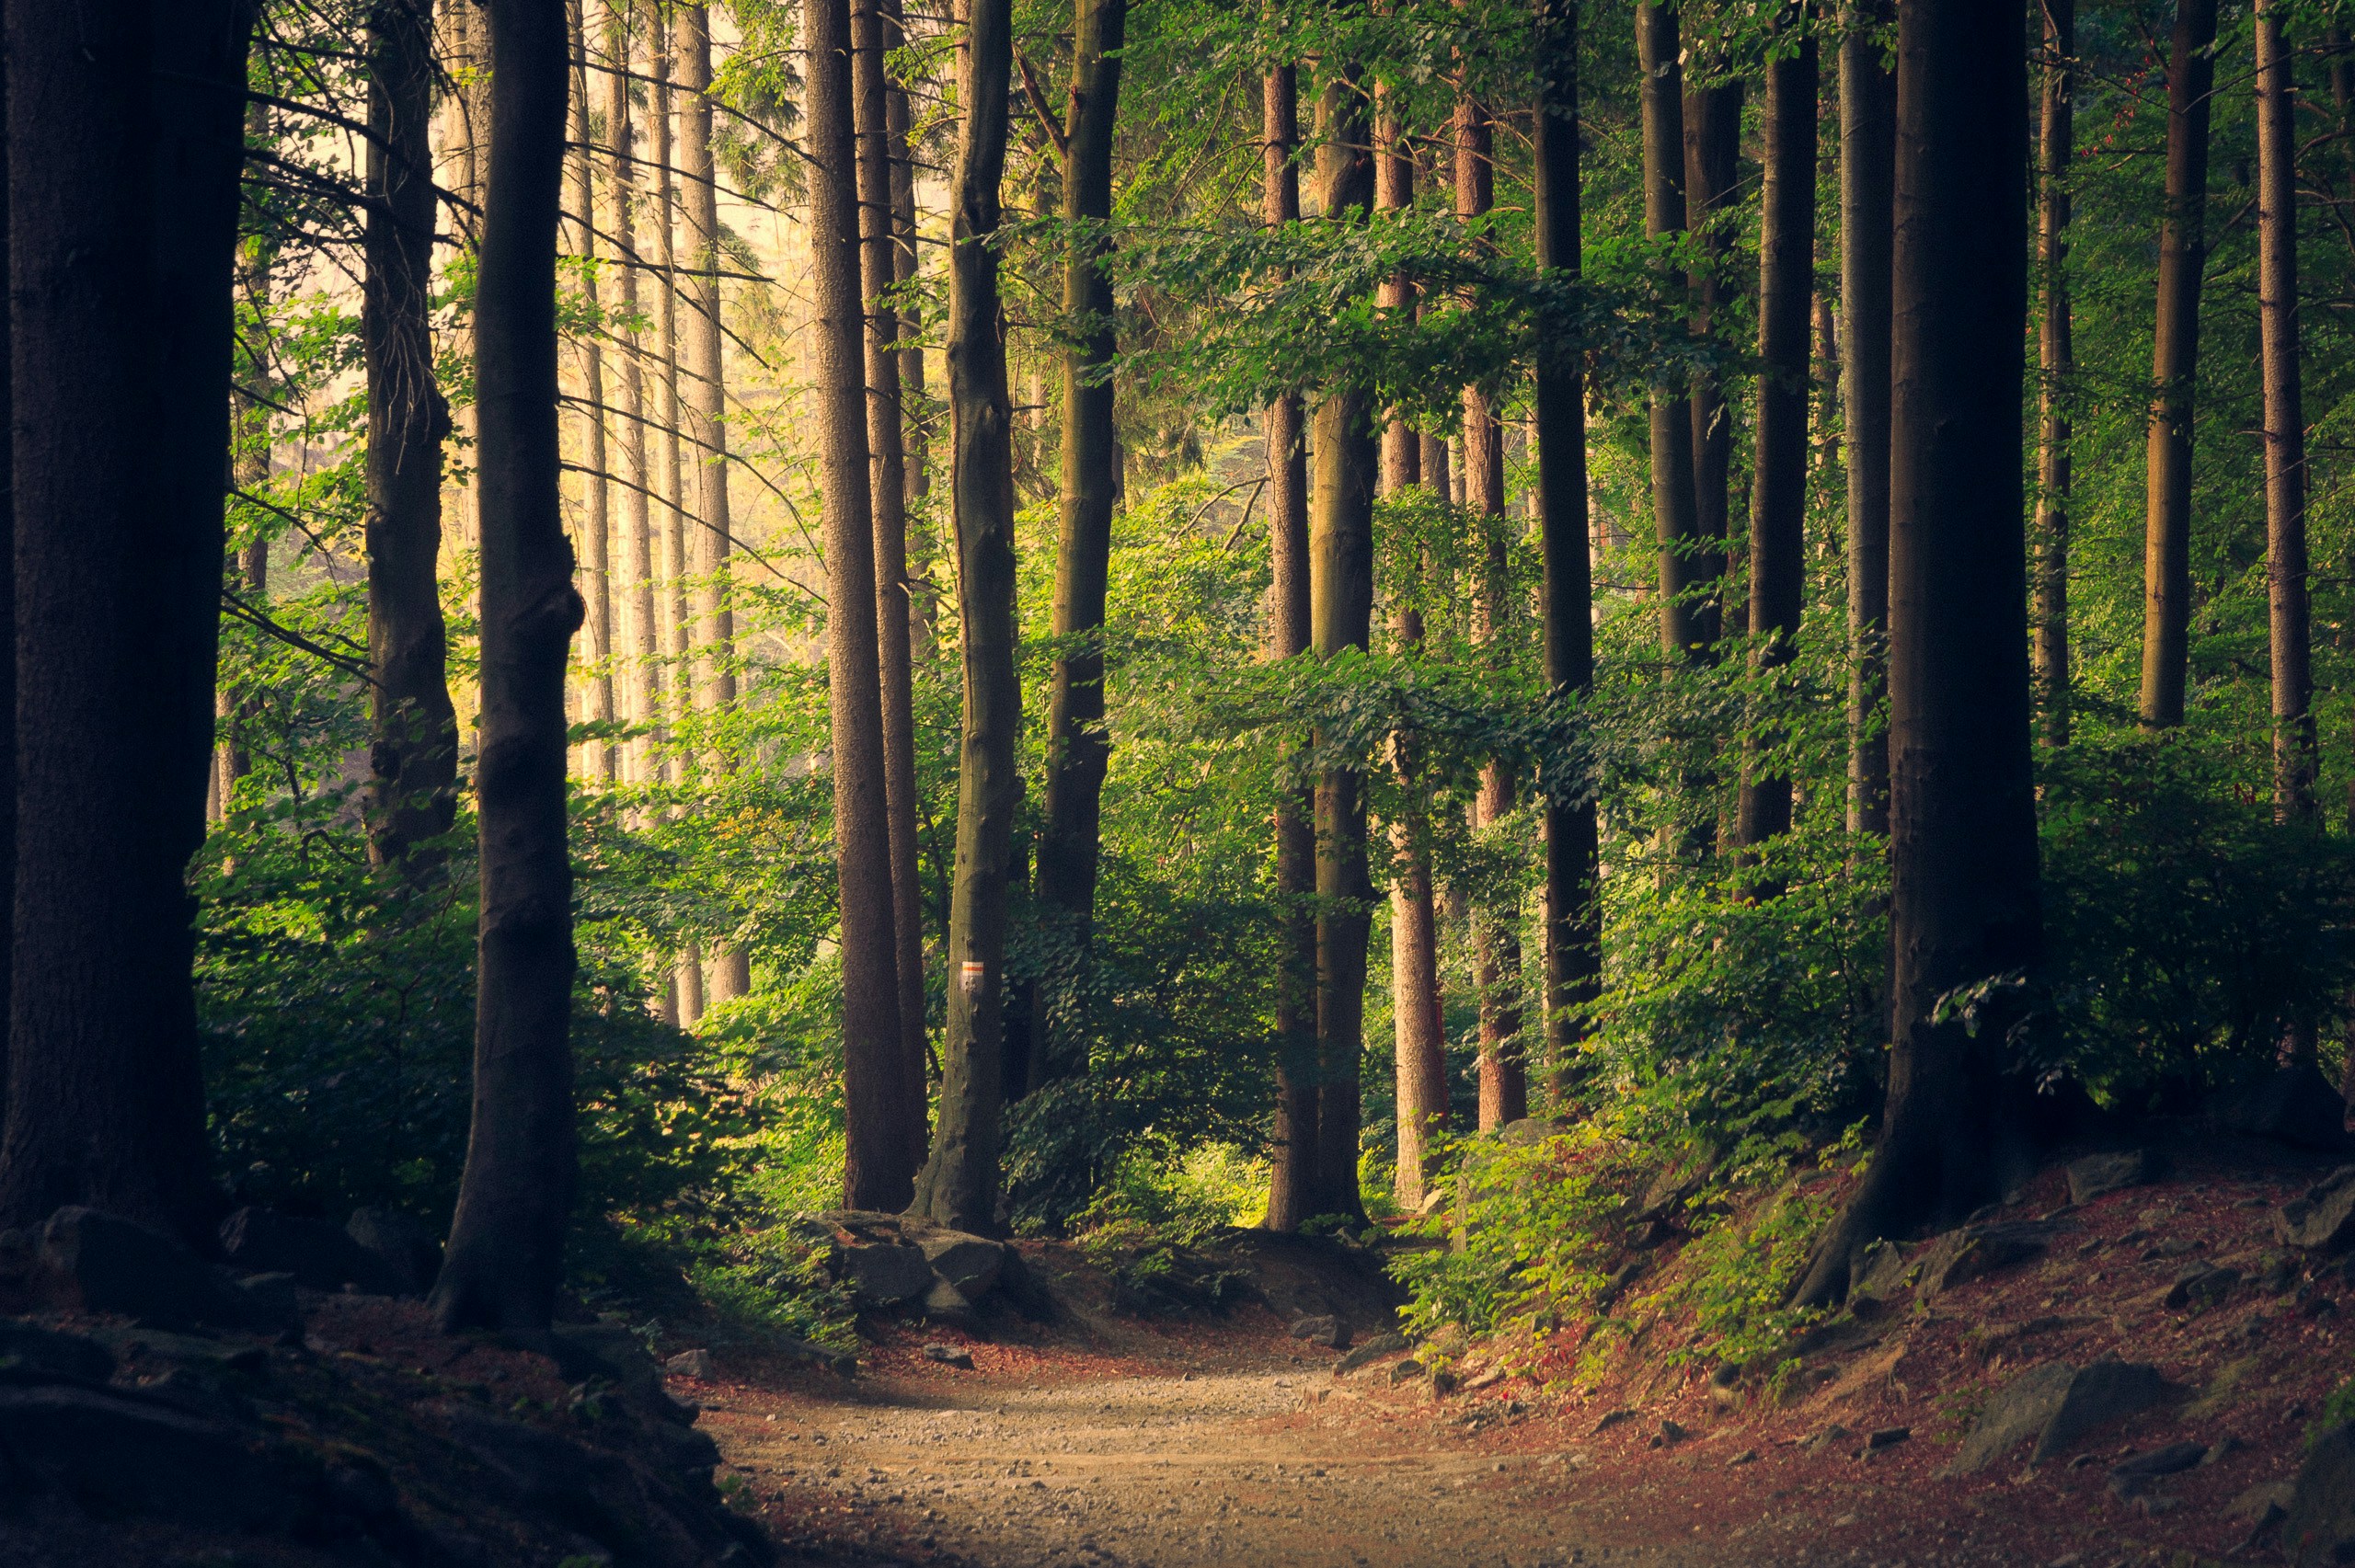
Forest School Philosophy
Forest schools originated in Scandinavia and have spread worldwide. The approach emphasizes child-led learning, outdoor experiences in all weather, and building confidence through managed risk.
- 1Regular outdoor sessions: Weekly visits to the same natural space
- 2Child-centered learning: Follow the child's interests and curiosity
- 3All-weather engagement: There's no such thing as bad weather, only unsuitable clothing
- 4Risk assessment: Teaching children to assess and manage risks themselves
In Scandinavian countries, children attend outdoor forest kindergartens year-round, even in temperatures as low as -10°C (14°F). This builds resilience and healthy immune systems.
Seasonal Nature Activities
Each season offers unique opportunities for outdoor learning and connection. Here's our guide to making the most of every season with your children.
Spring Awakening
Spring is the season of renewal and growth. Watch as nature comes alive with your little ones!
Summer Adventures
Long days mean endless outdoor possibilities! Here's a typical forest school summer day schedule:
Always apply broad-spectrum SPF 30+ sunscreen 30 minutes before going outside. Reapply every 2 hours and after water play. Provide wide-brimmed hats and encourage breaks in the shade.
Autumn Harvest
Fall is perfect for cooking with children! Try this wholesome apple cinnamon bread recipe made with foraged apples.
While baking, teach children about measurements, fractions, and patience. Baking is chemistry and math in action! Plus, the smell of cinnamon apples creates lasting memories.
Winter Wonderland
Don't let cold weather keep you inside! Winter offers magical learning opportunities.
- Track animal footprints in fresh snow
- Build shelters for woodland creatures
- Make ice ornaments with natural materials
- Pinecones, berries, evergreen sprigs
- Freeze in muffin tins overnight
- Hang on tree branches for birds to enjoy
- Study evergreen trees and winter adaptations
- Feed winter birds with homemade birdseed cakes
Never underestimate winter conditions! Layer clothing properly, watch for signs of cold stress, and limit outdoor time in extreme weather. If children's cheeks are red and burning, come inside immediately.
Essential Nature Gear
Having the right equipment makes outdoor adventures more comfortable and safe. Here's what every nature-loving family should have:
- 1Layered clothing system: Base layers, insulating layers, waterproof outer shells
- 2Quality rain boots: Waterproof, insulated for cold weather
- 3Nature exploration kit: Magnifying glass, field journal, colored pencils, collection bags
- 4First aid essentials: Band-aids, antiseptic wipes, tweezers for splinters, insect bite cream
- 5Snacks and water: Always bring more than you think you'll need!
Browse our complete nature exploration gear collection for families.
Common Mistakes to Avoid
Learn from others' experiences! Here are mistakes many families make when starting outdoor adventures:
Over-planning activities- Let children lead and discover naturallyStaying indoors in bad weather- Embrace all conditions with proper gearRushing experiences- Allow plenty of time for wandering and wonderingEliminating all risks- Calculated risks build confidence and competenceInterrupting play- Let children's imaginations run wild
Digital Documentation Tips
Use these shortcuts to quickly document your nature adventures in your digital journal:
- Quick photo: Press Cmd + Shift + 5 (Mac) or Win + Shift + S (Windows)
- Save journal entry: Cmd + S or Ctrl + S
- Add timestamp: Cmd + T or Ctrl + T
Bonus: Tech Integration
While we focus on unplugged outdoor time, here's a simple code snippet for creating a nature observation tracker app:
Recommended Resources
Continue your nature parenting journey with these trusted resources:
- Last Child in the Woods by Richard Louv - Essential reading on nature deficit disorder
- Forest School Association - Official guidelines and certification
- Nature Play - Ideas and inspiration for outdoor activities
- iNaturalist App - Citizen science platform for identifying plants and animals
Your Nature Journey Starts Today
Remember, you don't need perfect conditions or fancy equipment to start. The best time to begin connecting your children with nature is right now. Start small, stay consistent, and watch the magic unfold!
Choose one activity from this guide and commit to trying it this week. Share your experience with our community using #NatureParenting. Every journey into nature is a gift to your child's development.